


The MarkOne App
The MarkOne app consists of four main pages or views:
-
The Cockpit: This is a dashboard designed for active use while sailing from the cockpit.
-
The Logbook: This page offers a digital and automated alternative to the traditional paper logbook.
-
The Fusebox: Here, you can configure rules that act as a digital counterpart to fuses.
-
The Control Room: This is an analytics dashboard that provides direct access to the database.
These views can be accessed from the toolbar, which is located either on the left or the bottom of the screen, depending on the device's orientation. The toolbar also includes tools that are specific to the currently displayed view.
The Cockpit
The Cockpit is the main view of the application. It shows all data that you usually find scattered on a multitude of different displays and meters. It contains all data that you might need for a logbook entry or your navigational tasks in one place. It contains:
-
A map in the background. This map is used for orientation only and can not be used for serious navigational purposes as it does not include depth information. Maps are provided by open street map. On top of this map, useful navigational information such as waterways, buys, and lights are shown. An alternative view is the satellite view from google maps. The background can also be just plain white or black if no map is selected or the device is offline.
-
On top of the map, a large set of data can be displayed, most of them in data boxes. These are carefully designed to be nicely visible and at the same time allow one to monitor the map in the background. The data boxes can be configured to your needs, but the default selection has been carefully designed to meet the need of most users.
-
In the center of the display, there are two compass roses. The outer rose always points towards the north, while the inner rose is aligned with the heading of the boat. These compass roses dynamically adjust their size based on the screen dimensions. The boat's current position is represented by the center of the inner rose, unless the map is panned.
-
The outer compass rose displays various wind and course data relative to the north. This includes the course over ground (COG), heading (HDG), apparent wind direction (AWD), and true wind direction (TWD). Additionally, if a route or target is selected, the direction to the target is also indicated.
-
The inner compass rose presents the same set of data, but this time in relation to the heading of the boat. It provides information such as the apparent wind angle (AWA) and the true wind angle (TWA). Additionally, it displays the drag, which represents the difference between the course over ground (COG) and the heading (HDG).
-
The true wind direction, apparent wind direction, course over ground (COG), and heading are represented by arrows on the compass roses. The length of these arrows is proportional to the square root of their corresponding speed.
-
In the center of the compass roses, four data fields are displayed, and an additional four data fields are positioned in the corners of the square surrounding the roses. These data fields can be customized from the available data sets of Signal-K. By default, the inner four data boxes present speed-related information, while the outer four data boxes display directional data. The outer data boxes provide a more readable size and repeat the information shown on the compass roses.
-
In addition to the data fields displayed at the center and corners of the compass roses, there are 16 more data fields positioned either on the left and right edges or on the top and bottom edges, depending on the screen orientation. These data fields can be freely configured to display various information according to user preferences.
-
At the top edge of the display, the position coordinates and the date and time are prominently shown. This includes the latitude and longitude coordinates of the current position, as well as the date and time information.
-
At the bottom edge of the display, you will find essential information related to the engine, as well as the log mileage and details about the distance and bearing to a specific destination. This includes the engine revs, log mileage readings, and the distance and bearing information to the selected destination.
At the bottom edge, in the center of the display, the depth information is always shown. This essential data is consistently displayed and cannot be configured or customized.
-
At the top edge, in the center of the display, either the heading, course over ground (COG), or true wind direction (TWD) is shown, depending on the orientation of the view. This central data field dynamically adjusts to display the relevant information based on the rose orientation.
-
The view can be oriented in four different modes: North up, Head up, COG up, or Wind up. In the North up mode, the roses and map are oriented with the north direction at the top. In the Head up mode, the roses and map are oriented with the boat's heading at the top. In the COG up mode, the display is oriented with the course over ground (COG) at the top. In the Wind up mode, the display is oriented with the true wind direction at the top.
-
By performing a pinch or swipe motion on a touch device or using the mouse to pan and the mouse wheel to zoom, you can easily navigate the map. To focus solely on the map view, you have the option to hide the data boxes and compass rose by using the corresponding button located in the toolbar.
-
On the map, marks can be placed and seleced as target, routes can be specified and distances can be measured
-
Marks can be moved or removed, routes can be altered and new waypoints added
-
The clock at the top can be swaped out by a stop watch
-
A history of the Heading and TWD is shown as a series of fading dots
-
A polar diagram is generated from the incoming wind data
-
A target speed and a performance in percent according to the polar is calculated
-
Data fields are color coded and both show a short name like SOG and a long name like Speed over Ground in smaller caps
-
Different configurations of the dashboard can be stored and managed, like one for regatta, one for cruising
-
A log book is also in preparation, log book entries can be done from the dashboard with very few clicks
-
Log book entries can also be entered by automated rules (still work in progress)

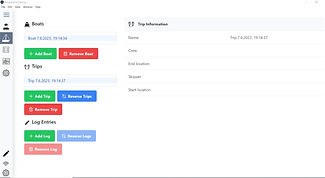
The Logbook
MarkOne also offers a logbook system in addition to the dashboard. After adding a new boat with all specifications like fuel, wastewater, battery, gas and other information, you can save trips. Also here information like skipper, end location and more are stored. Additional logs can be entered for each trip. With the addition of a status such as engine on and off, it can be looked up at any time what was done when and where.
The Fusebox
Another very useful feature is the fusebox. here, individual notifications of the sensor data can be set. For example, it should be logged when COG is between 0 and 30. All settings can be activated and deactivated at any time. Another example is an alarm when e.g. the depth is too low.

